The Hunt for Perfection in the Crash 500 Market
Let’s be honest for a moment. If you’ve spent any time on MetaTrader 5 (MT5) looking at synthetic indices, you know that Crash 500 is a unique beast. It’s the kind of market that can make you feel like a genius one minute and leave you scratching your head the next. I remember back in the day when I first started trading this pair; I thought every red candle was an invitation to jump in. I learned the hard way that chasing the market is a recipe for a blown account. To truly succeed, you need a system to identify High probability Crash 500 sell signals rather than just guessing where the next spike might occur.
Trading Crash 500 is fundamentally different from trading traditional Forex pairs. In Forex, price discovery is driven by global economics, interest rates, and geopolitical shifts. In the world of synthetic indices, we are dealing with algorithms designed to mimic real-world market behavior. This means technical analysis isn’t just a tool; it’s the entire playbook. In 2026, the algorithms have become more sophisticated, but the core human psychology—and the patterns it creates—remains remarkably consistent. If you want to stop being the liquidity for other traders, you have to wait for the market to show its hand.

Understanding the Mechanics of Crash 500
Before we dive into the specific setups, we have to clarify what we are actually looking for. In a “Crash” index, the “crash” happens through sudden, sharp downward spikes. The slow, grinding movement is usually upward. Therefore, the most profitable way to trade Crash 500 is by anticipating these downward movements. We aren’t looking to buy the dips; we are looking to sell the peaks.
A high-probability setup isn’t just about one indicator flashing a light. It’s about confluence. Think of it like building a legal case. One witness (an indicator) might be lying. Two witnesses make a stronger case. But when you have physical evidence (price action), three witnesses (indicators), and a solid motive (market structure), you have a case that’s hard to beat. That is exactly how we approach High probability Crash 500 sell signals.
The Role of Market Structure
If you don’t understand market structure, you’re essentially trading blind. The first thing I do every morning is zoom out to the H1 or H4 timeframe. Is the market making higher highs and higher lows, or is it starting to break down? For a sell signal to be considered “high probability,” it should ideally align with a bearish market structure.
- Lower Highs: When the market fails to break the previous peak, it’s a sign that the buyers are losing steam.
- Break of Structure (BOS): When the price pushes below a recent swing low, the character of the market has changed from bullish to bearish.
- The Return to Impulse: After a break of structure, price often retraces to the point where the move started. This is often where the gold is hidden.
The Top 3 High Probability Crash 500 Sell Signals
Over the years, I’ve tested hundreds of strategies. Most of them are noise. However, three specific setups consistently provide the highest win rates and the best risk-to-reward ratios. Let’s break them down so you can start spotting them on your charts.
1. The M-Pattern and Supply Zone Confluence
This is my bread and butter. The M-pattern, or Double Top, is a classic reversal signal. But here’s the secret: an M-pattern in the middle of nowhere is useless. You want to see that second peak of the “M” tapping into a fresh Supply Zone or an Order Block on a higher timeframe.
When the price returns to a level where a massive spike previously originated, there are usually “unfilled orders” left behind. When the price hits that zone again, the algorithm triggers those sell orders, leading to a high-probability crash. If you see the RSI (Relative Strength Index) showing divergence at the same time—meaning price makes a higher high but RSI makes a lower high—you have found one of the most reliable High probability Crash 500 sell signals available.
2. The Fibonacci Retracement at the 61.8% Golden Ratio
Fibonacci levels aren’t magic, but they act as psychological magnets for traders and algorithmic scripts alike. In a bearish trend, after a significant spike down, the market will almost always retraced upward. Many beginners try to sell immediately after the first spike, but the market often pushes higher to trap them.
Wait for the retracement to hit the 61.8% or 78.6% level. Look for a bearish engulfing candle or a pin bar at these levels. When the price hits the Golden Ratio within a clear bearish trend, the likelihood of a massive continuation spike is incredibly high. It’s all about patience. Let the market come to you.
3. Trendline Break and Retest
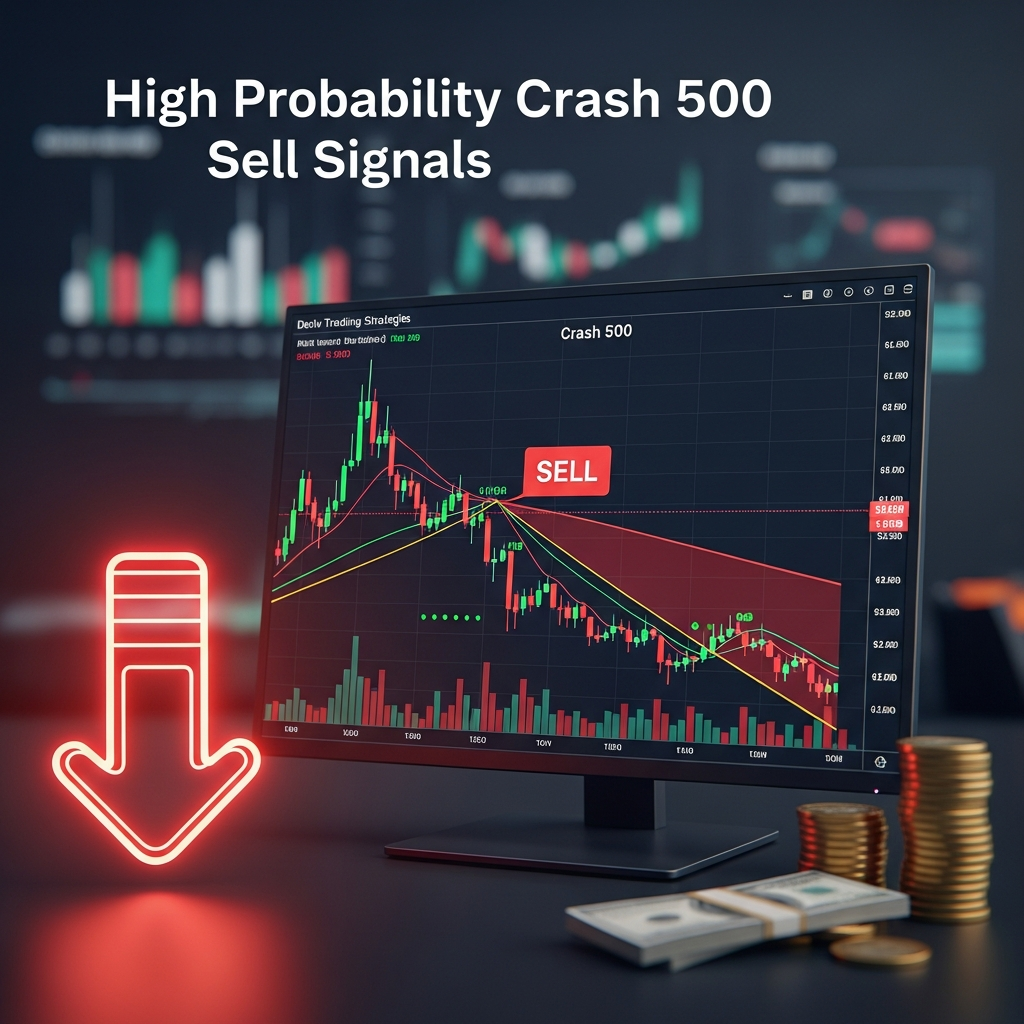
Trendlines are often criticized because they can be subjective, but in the Crash 500 market, they work surprisingly well when used for liquidity grabs. Draw a trendline connecting the lows of the upward retracement. When the price finally breaks below that trendline, don’t jump in immediately. That’s a rookie mistake. Wait for the price to come back and “kiss” the trendline from below. This retest confirms that the previous support has now become resistance. When that retest happens near a psychological level (like 5400.00 or 5500.00), you are looking at a prime entry point.
The Psychology of the Trade: Why Most Traders Fail
I’ve seen traders with the best strategies in the world still blow their accounts. Why? Because they lack the emotional discipline to wait for High probability Crash 500 sell signals. There is a psychological phenomenon called FOMO—Fear Of Missing Out. You see a small spike on the M1 chart and think, “Oh no, the big move is happening without me!” and you sell blindly. Then the market moves against you for 30 pips before the real crash happens. By then, your margin is gone.
Successful trading in 2026 requires a “sniper” mentality. A sniper doesn’t fire at every shadow; they wait for the target to enter the kill zone. If the market doesn’t hit your supply zone, you don’t trade. If the RSI isn’t overbought, you don’t trade. It is better to miss a profitable move than to be trapped in a losing one because you were impatient.
Refining Your Entry on the M1 Chart
While we look for the setup on the H1 or M15 charts, the entry usually happens on the M1. Once the price enters your higher-timeframe supply zone, look for a “shift in momentum.” This is often visible when the small green candles start getting smaller (loss of momentum) followed by a sharp, tiny red candle. That tiny red candle is often the precursor to the massive spike. Entry at this point allows for a very tight Stop Loss, which is the key to long-term survival.
Risk Management: The Shield of the Successful Trader
No matter how many High probability Crash 500 sell signals you identify, some trades will fail. That’s just the nature of the game. The difference between a professional and an amateur is how they handle those failures.
- The 1% Rule: Never risk more than 1% of your account on a single trade. If you have a $1,000 account, don’t lose more than $10. This allows you to survive a losing streak without emotional trauma.
- Stop Loss Placement: In Crash 500, your Stop Loss should be placed just above the supply zone or the previous swing high. If the price breaks that level, your setup is invalidated, and it’s time to get out.
- Trailing Your Profits: Once a spike happens and you are in the blue, move your Stop Loss to entry or use a trailing stop. Crash 500 can be volatile, and a winning trade can turn into a loser faster than you can blink.
The Importance of Confluence
I cannot stress this enough: confluence is the king of trading. If you have a supply zone, look for another reason to sell. Is there a moving average crossover? Is the stochastic oscillator showing an overbought condition? The more reasons you have to take the trade, the higher the probability. When three or four factors align, you aren’t just gambling; you are trading an edge.
Building a Daily Routine for Crash 500
To consistently find these signals, you need a routine. Random trading leads to random results. Start by scanning the Crash 500 chart every morning at the same time.
- Check the Daily (D1) timeframe to see the overall bias.
- Mark out the major H4 and H1 supply and demand zones.
- Look for any clear trendlines or chart patterns forming.
- Set alerts at your zones so you don’t have to stare at the screen all day.
- When an alert hits, drop down to the M5 and M1 to look for an entry trigger.
This systematic approach removes the emotion from the equation. You aren’t “feeling” like the market will crash; you are observing that the market has met your specific criteria for a high-probability trade.
Final Thoughts for Your Journey
Mastering High probability Crash 500 sell signals takes time, practice, and a whole lot of screen time. Don’t expect to become a millionaire overnight. Focus on the process, not the money. If you follow the rules and manage your risk, the money will naturally follow. Remember, the market is always there. There will be another setup tomorrow, another next week, and another next month. The only way to win is to stay in the game long enough for your edge to play out.
Take these strategies, backtest them on a demo account, and see how they feel for your personal trading style. Every trader is different, and you need to find the rhythm that works for you. Keep your head cool, your risk small, and your eyes on the high-probability setups. Happy trading, and may the spikes always be in your favor.