Why Trading the Volatility 100 Index Feels Like a Rollercoaster
If you have ever stared at a Volatility 100 index chart for more than five minutes, you know exactly what I am talking about. It is fast. It is aggressive. It does not care about the Federal Reserve, non-farm payrolls, or what some CEO tweeted at 3 AM. It is a mathematical beast that moves with a constant volatility, and for many traders, it feels like trying to taming a wild stallion while blindfolded.
The year is 2026, and the popularity of synthetic indices has exploded. Why? Because the 24/7 nature of these markets fits our modern, high-speed lifestyle. But here is the catch: because V100 moves so differently from traditional currency pairs, using the wrong tools is a recipe for a blown account. You need a specific toolkit. You need to know the best indicators for Volatility 100 index to actually stand a chance against the algorithm.
I remember my first week trading this index. I thought my standard Forex setup would work perfectly. I loaded up my chart with five different indicators, waited for a signal, and… bam. My stop loss was hit before I could even take a sip of coffee. That is when I realized that V100 requires a blend of momentum tracking and volatility expansion analysis. It is not about how many indicators you have; it is about how they talk to each other.

Understanding the Nature of Volatility 100
Before we dive into the specific tools, let’s get one thing straight. The V100 index is designed to reflect a constant volatility of 100%. This means the price action is smooth but incredibly rapid. Unlike the V75 which can be a bit more erratic, the V100 has a rhythmic flow to it if you know where to look. It trends hard, and when it breaks, it breaks fast.
Because there is no underlying physical asset or economic news driving the price, technical analysis is your only friend. This is pure price action at its finest. You are trading against a randomized algorithm that follows mathematical probabilities. This is why the best indicators for Volatility 100 index are those that measure the speed of movement and the deviation from the mean.
Bollinger Bands: The King of Volatility Indicators
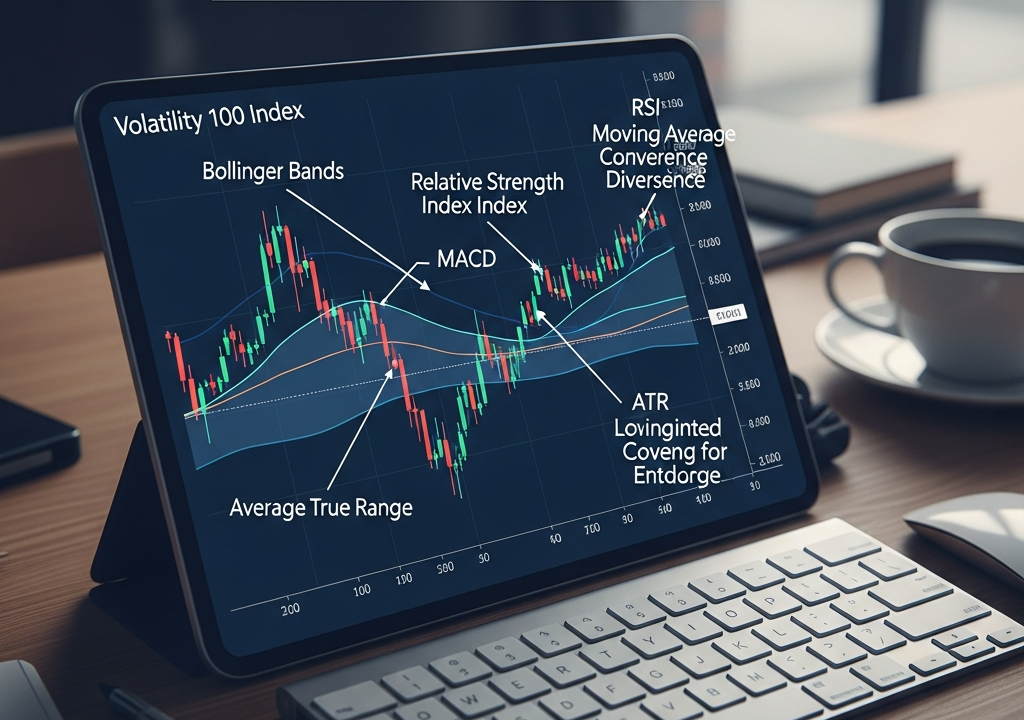
When I talk about the best indicators for Volatility 100 index, Bollinger Bands always sit at the top of my list. Why? Because the V100 is literally defined by its volatility, and John Bollinger’s creation is the gold standard for measuring just that.
In 2026, many traders make the mistake of using the default settings (20 period, 2 deviation) and expecting magic. On the V100, the price often “walks the bands.” This means when a trend starts, the price will hug the upper or lower band for a long time. If you try to sell just because the price touched the upper band, the V100 will likely run right over you.
The trick I have found most useful is looking for the “Bollinger Squeeze.” When the bands get tight, it means the index is resting. On a V100 chart, rest never lasts long. When those bands start to flare out like a trumpet, a massive move is coming. That is your cue. Don’t fight the expansion; ride it.
The RSI: Finding the Exhaustion Points
The Relative Strength Index (RSI) is the perfect partner for Bollinger Bands. While the bands tell you where the price *could* go, the RSI tells you if the move is running out of steam. For the V100 index, I prefer using a slightly faster setting, perhaps a 10 or 12 period instead of the standard 14. This accounts for the index’s rapid-fire nature.
Look for divergence. If the V100 price makes a new high but the RSI makes a lower high, the algorithm is likely preparing for a mean reversion. In my experience, RSI levels of 70 and 30 are still relevant, but on the V100, wait for the RSI to actually hook back inside the range before clicking that sell or buy button. Patience is the difference between a winning trade and a frustrated screen-slam.

The Power of Moving Averages in a Trending Market
V100 loves a good trend. When it starts moving, it can stay in that direction for hours, sometimes days. This is where Moving Averages (MAs) become one of the best indicators for Volatility 100 index. But don’t just use any MA. The Exponential Moving Average (EMA) is superior here because it reacts faster to recent price changes.
A classic strategy that still dominates in 2026 is the 50-period and 200-period EMA crossover. On a 15-minute or 1-hour chart, when the 50 EMA crosses above the 200 EMA, you are looking at a strong bullish regime. The V100 has a habit of retracing back to the 50 EMA during a strong move. Instead of chasing the price, wait for it to touch that 50 EMA line. It often acts as a trampoline, bouncing the price back into the original direction.
Average True Range (ATR): Your Risk Management Bestie
Let’s be real: most traders fail not because their entries are bad, but because their stop losses are terrible. They put a 10-pip stop loss on a market that moves 50 pips in a heartbeat. This is why the Average True Range (ATR) is vital. It measures the average volatility over a set period.
When you are setting your stop loss on the V100, look at the ATR. If the ATR says the average move is 20 points, and you put your stop at 5 points, you are basically donating money to the broker. Use a multiplier of the ATR (like 1.5x or 2x) to give your trade room to breathe. The V100 is a heavy breather; it needs space.
The Parabolic SAR: For the Trend Followers
If you struggle with knowing when to exit a trade, the Parabolic SAR (Stop and Reverse) is a fantastic tool for the V100. Those little dots that appear above or below the price are surprisingly accurate when the index is trending.
I like to use the Parabolic SAR as a trailing stop. As long as the dots are below the price, I stay in my buy position. The moment a dot appears above the price, I take my profits and walk away. It prevents you from getting greedy and watching a massive profit evaporate because you thought the V100 would “keep going forever.”
Combining Them: The Ultimate V100 Strategy
You shouldn’t use all these indicators at once. Your chart would look like a bowl of spaghetti. Instead, create a synergy. A great combination for the best indicators for Volatility 100 index might look like this:
- The Foundation: 50 EMA for trend direction.
- The Trigger: Bollinger Band Squeeze for entry timing.
- The Filter: RSI to avoid buying at the absolute top.
- The Exit: ATR-based stop loss and Parabolic SAR trailing.
Imagine the 50 EMA is pointing up. The price has been consolidating in a tight Bollinger Band squeeze. Suddenly, a candle closes outside the upper band, and the RSI is sitting at 60 (not yet overbought). You enter a buy. You place your stop loss based on the current ATR. You hold the trade until the Parabolic SAR flips. That is a systematic, human-led approach to a mathematical market.
The Psychological Game of V100
Even with the best indicators for Volatility 100 index, you can still lose money if your head isn’t in the game. The speed of V100 can trigger “fight or flight” responses. You see red, and your heart rate spikes. You see green, and you start wondering what color Lamborghini you want.
In 2026, the most successful traders I know are the ones who treat V100 like a job, not a casino. They use their indicators to take the emotion out of the equation. If the indicators don’t align, there is no trade. It does not matter if you *feel* like the price is going up. If the 50 EMA and the Bollinger Bands say stay out, you stay out. The market will always be there tomorrow. Your capital might not be if you trade on vibes instead of data.
Common Pitfalls to Avoid
One major mistake is over-trading. Because the V100 index never sleeps, you might feel the urge to trade at 4 AM on a Tuesday. Just because the market is active doesn’t mean you should be. Stick to your high-probability setups. Another pitfall is ignoring the timeframe. What looks like a massive reversal on the 1-minute chart might just be a tiny flicker on the 4-hour chart. Always check the higher timeframes to see the “big picture” trend before zooming in to scalp.
Also, beware of “indicator lag.” Remember that most indicators are based on past price action. They tell you what happened, not necessarily what *will* happen. This is why using them in combination—looking for confluence—is so important. When three different tools tell you the same thing, the probability of success shifts in your favor.
A Final Word on Mastering the V100
Trading the Volatility 100 index is a journey of discipline. It is one of the most exciting markets available in 2026, offering liquidity and movement that Forex traders can only dream of. But it demands respect. By integrating the best indicators for Volatility 100 index—Bollinger Bands, RSI, EMA, and ATR—you give yourself a map in a very chaotic territory.
Take these tools, spend some time on a demo account, and see how they feel to you. Every trader is different. Some love the fast signals of the RSI, while others prefer the steady guidance of the Moving Averages. Find your rhythm, manage your risk like a professional, and stop treat the index like a gamble. When you align your strategy with the inherent mathematical nature of the V100, the results usually speak for themselves.
Before you place your next trade, take a deep breath. Look at your bands. Check your RSI. Verify your trend with the EMA. If everything looks good, execute with confidence. The V100 is waiting, and now you have the right tools to tackle it.