The Moment I Almost Blew My Entire Account
It was a Tuesday afternoon back in early 2026. I remember it vividly because the coffee was cold and my heart was racing at a speed that felt medically concerning. I had found what I thought was the ‘perfect’ setup on a tech stock. The chart was screaming ‘buy,’ the sentiment was bullish, and I was feeling overconfident. Instead of calculating my risk, I just ‘eyeballed’ it. I figured a few hundred shares wouldn’t hurt. By Wednesday morning, a surprise earnings revision sent the stock gapping down 15%. Because I hadn’t sized my position correctly, that single ‘perfect’ trade wiped out two months of hard-earned profits. It was a wake-up call. I realized that while strategy gets you into the game, position sizing keeps you in the game. That’s why I finally sat down to build what eventually became this advanced position sizing spreadsheet download.
Most traders focus 90% of their energy on where to enter and 10% on how much to buy. Professional traders do the exact opposite. In the volatile markets of 2026, where AI-driven flash crashes and instant global sentiment shifts are the norm, guessing your position size is essentially financial suicide. You need a system that removes the emotion and replaces it with cold, hard math.
Why You Are Still Losing Money (Hint: It’s Not Your Strategy)
Let’s be real for a second. You probably have a decent strategy. You might even have a winning strike rate. But if your losers are twice as big as your winners because you’re ‘betting big’ when you feel good and ‘playing small’ when you’re scared, your equity curve is going to look like a mountain range of despair. This is where the psychology of trading meets the reality of mathematics.
The problem with manual calculation is that when the market is moving fast, our brains take shortcuts. We think, ‘Oh, $1,000 risk sounds fine,’ without realizing that on a high-volatility asset, that $1,000 risk requires a stop-loss so tight it’ll get hit by noise before the move even starts. Or worse, we take a position so large that a tiny move against us triggers a margin call. An advanced position sizing spreadsheet download acts as a logical circuit breaker. It forces you to look at the numbers before you click that ‘buy’ button.
The Math of Recovery
If you lose 10% of your account, you need an 11.1% gain to get back to even. Not bad, right? But if you lose 50%, you need a 100% gain just to see your starting balance again. Most retail traders never recover from a 50% drawdown because they lack the emotional fortitude to trade perfectly for the months it takes to double their money. Proper sizing prevents you from ever entering that ‘death zone’ of drawdown.
What Makes This Spreadsheet Different?
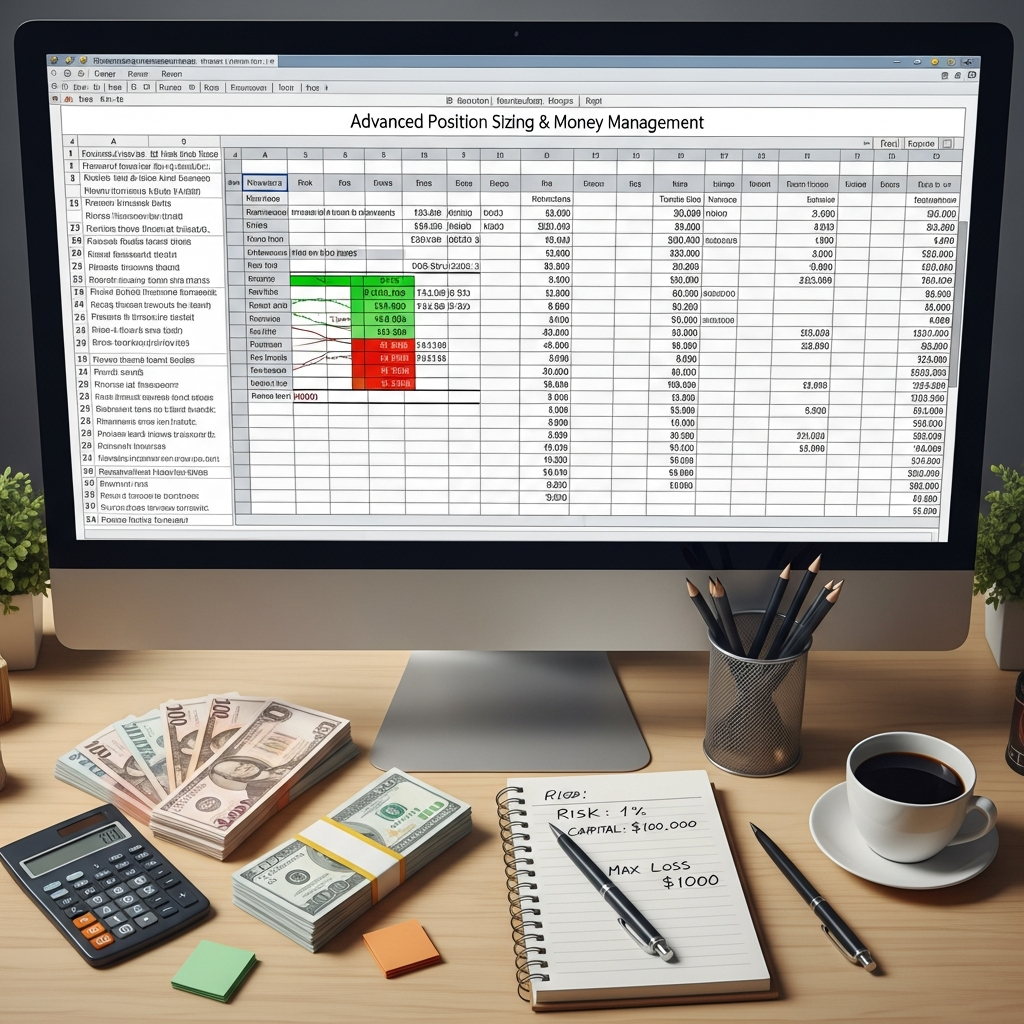
There are a million basic calculators online that tell you how many shares to buy based on a 2% risk. That’s child’s play. To survive in today’s environment, you need something more robust. When we talk about an advanced position sizing spreadsheet download, we’re talking about a tool that handles the nuances of modern trading.
- Multi-Asset Capability: Whether you’re trading Forex, Crypto, Stocks, or Options, the math changes. This spreadsheet adjusts for pip values, tick sizes, and contract multipliers automatically.
- The Kelly Criterion Integration: For those who want to get aggressive, the spreadsheet includes an optional Kelly Criterion calculator to help you determine the optimal percentage of your capital to risk based on your historical win rate and profit factor.
- Volatility-Adjusted Stops (ATR): It pulls or allows you to input the Average True Range (ATR) so your stop-loss isn’t just a random number, but a reflection of the asset’s current ‘breath.’
- Portfolio Heat Tracking: This is the big one. It tracks your ‘total open risk.’ If you have five trades open, each risking 1%, your total portfolio heat is 5%. The spreadsheet warns you when you’re becoming too correlated or over-leveraged.

Step-by-Step: Using Your Advanced Position Sizing Spreadsheet Download
I designed this tool to be used in under 30 seconds. If it takes longer than that, you won’t use it when the market is heating up. Here is the workflow I use every single morning.
1. The Foundation: Account Equity
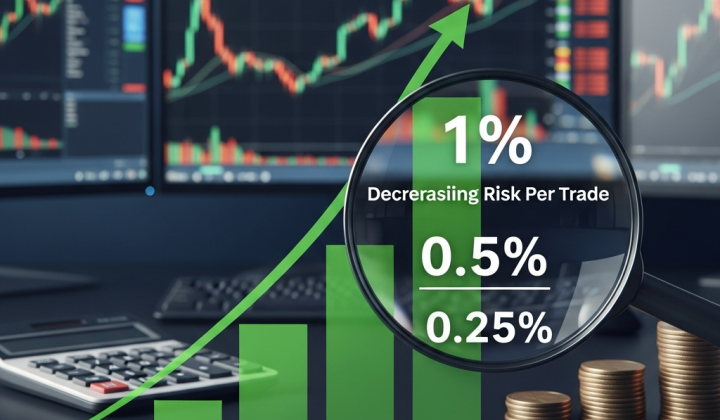
First, you input your current liquid equity. Not your ‘starting’ balance from three years ago, but what you actually have today. The spreadsheet uses this to calculate your ‘Risk Amount’ in dollars. I usually suggest risking 0.5% to 1.5% per trade. In 2026, with the way markets can gap, 2% is the absolute ceiling.
2. The Variable: Asset Volatility
Instead of just picking a price point for a stop-loss, look at the ATR. If the ATR on the daily chart is $5.00, placing a stop-loss only $2.00 away from your entry is asking for a stop-out. The spreadsheet allows you to input an ATR multiplier (like 1.5x or 2x) to suggest a ‘safe’ distance for your stop-loss based on current market noise.
3. The Execution: Entry and Exit
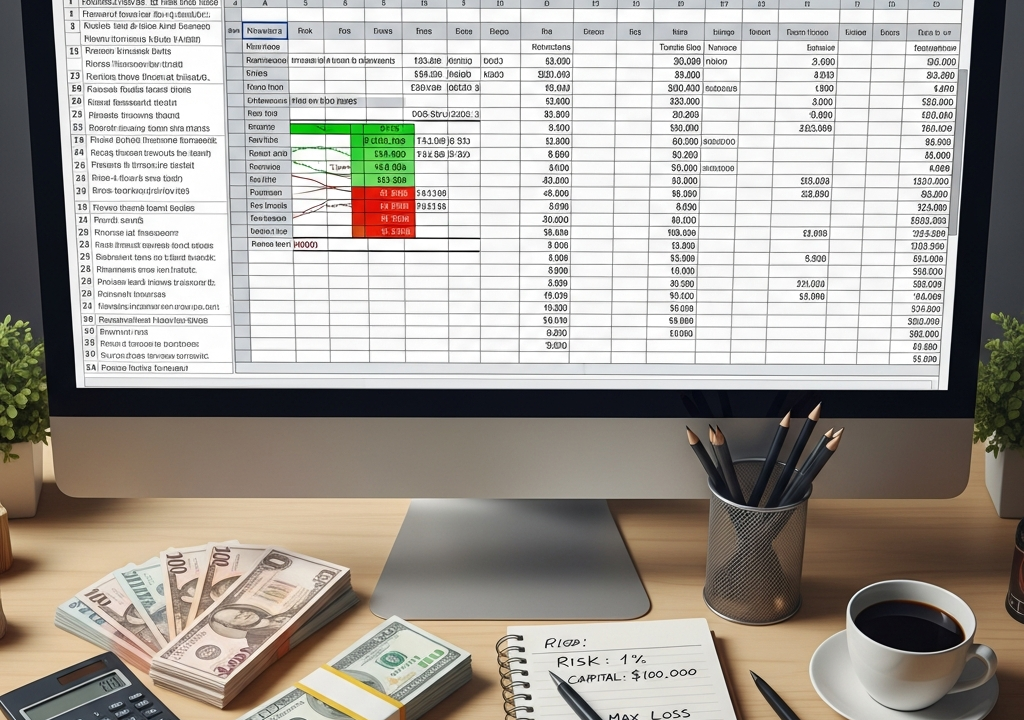
Once you put in your entry price and your stop-loss price, the spreadsheet does the heavy lifting. It tells you exactly how many units to buy. If the number looks too big, it’s probably because your stop is too tight. If the number looks small, it’s because the volatility is high. Trust the math, not your gut.
4. The R-Multiple Reality Check
Before you take the trade, the spreadsheet asks for your ‘Target Price.’ It then calculates your R-Multiple (Reward-to-Risk ratio). If the ratio is less than 2:1, the spreadsheet highlights the cell in red. This has saved me from dozens of ‘low-probability’ trades where I was risking $100 to make $50. In the long run, those trades are account killers.
The Psychology of the Spreadsheet
There’s a strange sense of peace that comes over you when you know your downside is capped. I used to stare at the screen, sweating every tick against me. Now? If a trade hits my stop, I don’t get angry. I know exactly how much I lost, and I know that my advanced position sizing spreadsheet download already accounted for that loss in my overall portfolio plan. It turns trading from a high-stakes gamble into a boring, repetitive business process. And in trading, boring is where the money is.
Think about the best traders in history. They weren’t the ones with the ‘magic’ indicators. They were the ones who managed risk with obsessive precision. By using a standardized tool, you’re removing ‘Decision Fatigue.’ You don’t have to decide how much to risk; the spreadsheet decides for you based on the rules you set when you were calm and rational.
Common Pitfalls to Avoid
Even with the best tools, humans find ways to mess things up. Here are a few traps I’ve seen traders fall into, even after they get their hands on an advanced position sizing spreadsheet download:
- Lying to the Spreadsheet: Don’t tighten your stop-loss in the calculator just so you can buy more shares. That’s called ‘reverse engineering your risk,’ and it leads to getting stopped out on perfectly good trades.
- Ignoring Correlation: If you buy Bitcoin, Ethereum, and Solana at the same time, you aren’t in three trades. You’re in one giant ‘crypto-up’ trade. If you risk 1% on each, your total risk is effectively 3% on the same move. The spreadsheet helps track this, but you have to be honest with your inputs.
- Forgetting Commissions and Slippage: Many calculators forget that it costs money to enter and exit. This spreadsheet includes a field for estimated slippage, especially important for those trading low-liquidity altcoins or small-cap stocks.
Customizing the Tool for Your Style
Every trader is different. Maybe you’re a scalper who takes 20 trades a day, or a swing trader who holds for months. The beauty of a spreadsheet over a web-based app is that you can customize it. I’ve added a ‘Trade Journal’ tab to mine where it automatically pulls the data from the calculator. This way, at the end of the month, I can see if my 2-ATR stops performed better than my 1.5-ATR stops.
If you find yourself constantly adjusting your risk because you’re on a ‘winning streak,’ stop. That’s the ‘Gambler’s Fallacy’ creeping in. Stick to the numbers provided by your advanced position sizing spreadsheet download. The math doesn’t have an ego; it doesn’t care about your winning streak. It only cares about the probability of ruin.
Final Thoughts: Your Future Self Will Thank You
Trading is a marathon, not a sprint. The traders who are still around in 2027 and 2030 won’t be the ones who got lucky on a 100x leverage moonshot. They will be the ones who treated their capital like a precious resource. Using an advanced position sizing spreadsheet download is the single most effective way to transition from an amateur to a professional.
Imagine your life six months from now. You’re no longer checking your P&L every five minutes with a knot in your stomach. You’re placing trades with confidence, knowing that even if you lose three in a row, your account is perfectly safe. That peace of mind is worth more than any ‘hot tip’ or ‘secret indicator’ you’ll ever find. Download the tool, set your rules, and start trading like the professional you were meant to be. Your equity curve—and your stress levels—will thank you.
Frequently Asked Questions
Does this spreadsheet work for Crypto?
Absolutely. You just need to input the correct decimal places for the coin you are trading. The math of percentage-based risk remains the same regardless of the asset.
Can I use this on Google Sheets or Excel?
Yes, it is compatible with both. I personally prefer Google Sheets because it allows me to access my risk calculations from my phone if I need to manage a trade while away from my desk.
Is the 1% risk rule still relevant in 2026?
It depends on your win rate. For most traders, 1% is the ‘sweet spot.’ However, if you have a very high win rate (over 60%), you might use the spreadsheet to calculate if a 1.5% or 2% risk is mathematically sound using the Kelly Criterion tab.