
The Moment the Screen Turns Red
We have all been there. You are sitting in front of your dual-monitor setup, the coffee is getting cold, and the trade you were so certain about has just hit your stop loss. Or worse, you didn’t set a stop loss, and you are watching your equity curve dip into a valley that feels more like a canyon. That sinking feeling in your stomach? That is the visceral reality of a drawdown.
In the trading world, we talk a lot about ‘alpha,’ ‘moon bags,’ and ’10x gains.’ But we rarely talk about the math of the comeback. If you lose 10% of your account, you might think you just need a 10% gain to get back to where you started. Unfortunately, the universe is not that kind. Mathematics has a cruel sense of humor when it comes to trading capital, and understanding this ‘asymmetry of loss’ is what separates the professionals from the hobbyists who blow their accounts by mid-February.
To survive in 2026, where algorithmic volatility can wipe out a retail account in milliseconds, you need a map. That map is the drawdown recovery table for traders. It is not just a list of numbers; it is a reality check that should be taped to your monitor or saved as your phone wallpaper.
The Brutal Math: Why a 50% Loss Is Not a 50% Recovery
Let’s look at the numbers without the fluff. Imagine you have a $10,000 trading account. You go on a losing streak—maybe it was a series of bad calls on some volatile tech stocks, or perhaps you got caught on the wrong side of a central bank announcement. Your account drops to $5,000. That is a 50% drawdown.
Now, to get back to your original $10,000, you need to make $5,000 profit. But you only have $5,000 left to trade with. Making $5,000 from a $5,000 base is a 100% gain. You have to double your remaining money just to get back to zero. This is the mathematical trap of trading. The deeper you sink, the steeper the mountain becomes.
The Asymmetry of Loss Explained
Most new traders don’t internalize this until it’s too late. They treat their account like a linear scoreboard, but it’s actually geometric. As your capital shrinks, your ‘leverage’ over the market (your ability to take meaningful positions) shrinks with it, while the performance required to recover grows exponentially.
This is exactly why a drawdown recovery table for traders is the most important tool in your risk management arsenal. It visualizes the danger zones before you enter them.
The Essential Drawdown Recovery Table for Traders
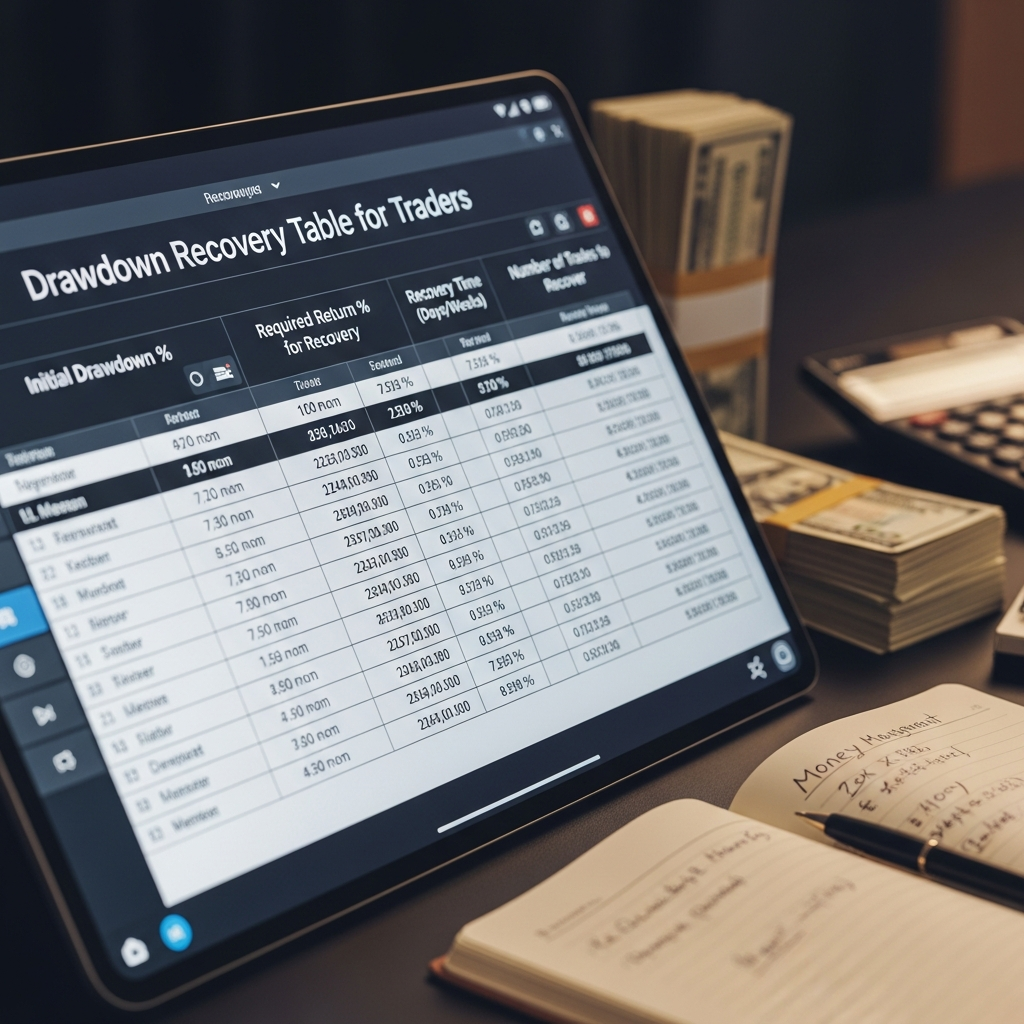
Below is the breakdown that every trader needs to memorize. This table shows the percentage of drawdown (loss) and the corresponding percentage gain required to return to the original starting balance (breakeven).
| Drawdown (Account Loss %) | Recovery Gain Required (%) |
|---|---|
| 5% | 5.3% |
| 10% | 11.1% |
| 15% | 17.6% |
| 20% | 25.0% |
| 25% | 33.3% |
| 30% | 42.9% |
| 40% | 66.7% |
| 50% | 100.0% |
| 60% | 150.0% |
| 75% | 300.0% |
| 90% | 900.0% |
Look at that last row. If you lose 90% of your account, you need a 900% gain—nearly a 10-bagger—just to get back to your starting point. In what world is it easy to find a 900% return? It’s not. That is the world of ‘hope trading,’ and it usually ends in a total account wipeout.
The Psychological Trap of the 20% Mark
There is a psychological ‘point of no return’ for many traders, and it usually happens around the 20% to 25% drawdown mark. Up until 10%, most people stay relatively calm. They think, ‘Okay, a few good trades will fix this.’ And they are right—an 11.1% gain is very achievable.
But once you hit a 25% loss, you realize you need a 33.3% gain to recover. That is when ‘Revenge Trading’ kicks in. You start increasing your lot sizes. You start looking for the ‘home run’ trade to make it all back in one go. You stop following your system because your system only makes 2% a month, and at that rate, it would take you forever to get back to break even.
In 2026, with the markets moving faster than ever due to AI-driven liquidity, this emotional spiral is even more dangerous. If you don’t respect the drawdown recovery table for traders, you will find yourself taking high-leverage gambles that move you from a 25% drawdown to a 50% drawdown in a single afternoon.

How to Use This Table to Save Your Portfolio
Knowledge without action is just trivia. Here is how you actually implement this data into your daily trading routine to ensure you never have to face a 100% recovery requirement.
1. Set Hard ‘Uncle’ Points
Professional fund managers have ‘drawdown limits.’ For example, if they lose 5% in a month, they stop trading for the rest of the month. If they lose 10% in a year, they shut down the fund and return capital to investors. You need an ‘Uncle Point.’ Decide now: at what percentage of loss will you walk away from the screen for a week? If you know that a 20% loss requires a 25% gain to recover, maybe your ‘Uncle Point’ should be 15%.
2. Adjust Your Position Sizing Dynamically
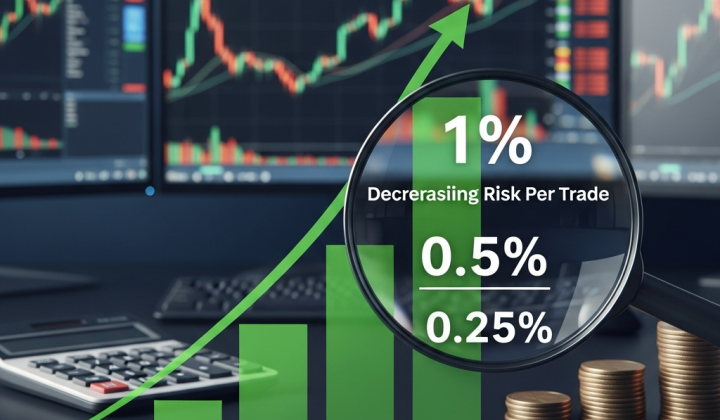
Most traders use a fixed percentage of risk, like 1% per trade. But when you are in a drawdown, you should actually decrease your risk. If you are down 10%, drop your risk per trade to 0.5%. It sounds counter-intuitive—you want to make the money back faster, right? No. You want to survive. Lowering your risk when you are losing protects your remaining ‘bullets’ and prevents the drawdown from accelerating toward the 50% cliff.
3. Focus on the ‘Process’ Gain, Not the ‘Dollar’ Gain
When you look at the drawdown recovery table for traders, don’t focus on the dollars you lost. Focus on the percentage you need to win. If you need a 17.6% gain to recover from a 15% loss, break that 17.6% down into smaller chunks. Can you make 2% a week for nine weeks? That feels much more manageable than ‘I need to make $2,000 back today.’
A Story of Two Traders: Alex vs. Sam
Let’s look at how two different traders handle a rough patch in the 2026 markets. Both start with $50,000.
Alex ignores the math. He hits a 20% drawdown after a bad week in the crypto markets. His account is at $40,000. Feeling the pressure, he doubles his position size on the next trade to ‘catch up.’ The trade goes against him by 10%. Because he doubled his size, his account drops another 20%. Now he’s down 40% overall ($30,000). According to our table, Alex now needs a 66.7% gain to recover. Panic sets in. He takes an all-in trade, it fails, and he’s out of the game.
Sam has the drawdown recovery table for traders printed on his desk. He also hits that same 20% drawdown. He sees that he needs a 25% gain to recover. Instead of doubling up, Sam cuts his risk in half. He focuses on high-probability setups and slowly grinds out small wins. It takes Sam four months to get back to $50,000, but he never risked total ruin. He is still a trader, while Alex is looking for a new job.
The Invisible Cost of Drawdown: Mental Capital
The table shows the financial cost, but it doesn’t show the mental cost. Trading in a drawdown is like playing sports with an injury. You are hesitant. You exit winning trades too early because you are scared of losing the small profit you have. You hold losing trades too long, hoping they turn around so you don’t have to realize another loss.
This ‘mental drawdown’ is often harder to recover from than the financial one. By keeping your drawdowns small (ideally under 10-15%), you keep your head clear. You can still make rational decisions. Once you cross into the 30% or 40% territory, you are no longer trading; you are gambling with your emotions.
Conclusion: Respect the Math, Stay in the Game
The markets in 2026 are a beautiful, chaotic mess of opportunity and risk. New technologies have made it easier to enter trades but haven’t changed the fundamental laws of math. Whether you are trading Forex, Stocks, or the latest DeFi protocols, the drawdown recovery table for traders remains the ultimate truth.
Treat your trading capital like your lifeblood. Protect it with everything you have. Remember that your primary job is not to make money—it is to keep the money you have so that you are still around when the next great bull market begins. If you find yourself slipping into a dip, pull out this table, look at the recovery percentages, and ask yourself: ‘Is this trade worth the climb I’ll have to make if it fails?’
Stay disciplined, manage your risk, and let the math work for you, not against you.