Why Your Spreadsheets Are Holding You Back in 2026
Let’s be honest for a second. Most of us started our trading journey with a simple Excel sheet or, worse, a physical notebook. You’d write down your entry price, your exit, and maybe a little note like “felt good about this one.” But then the market does what it always does—it throws a curveball. You hit a losing streak, and suddenly that spreadsheet feels like a graveyard of bad decisions rather than a tool for growth. You look at the numbers, but they don’t tell you *why* you’re losing. They just show you that you are.
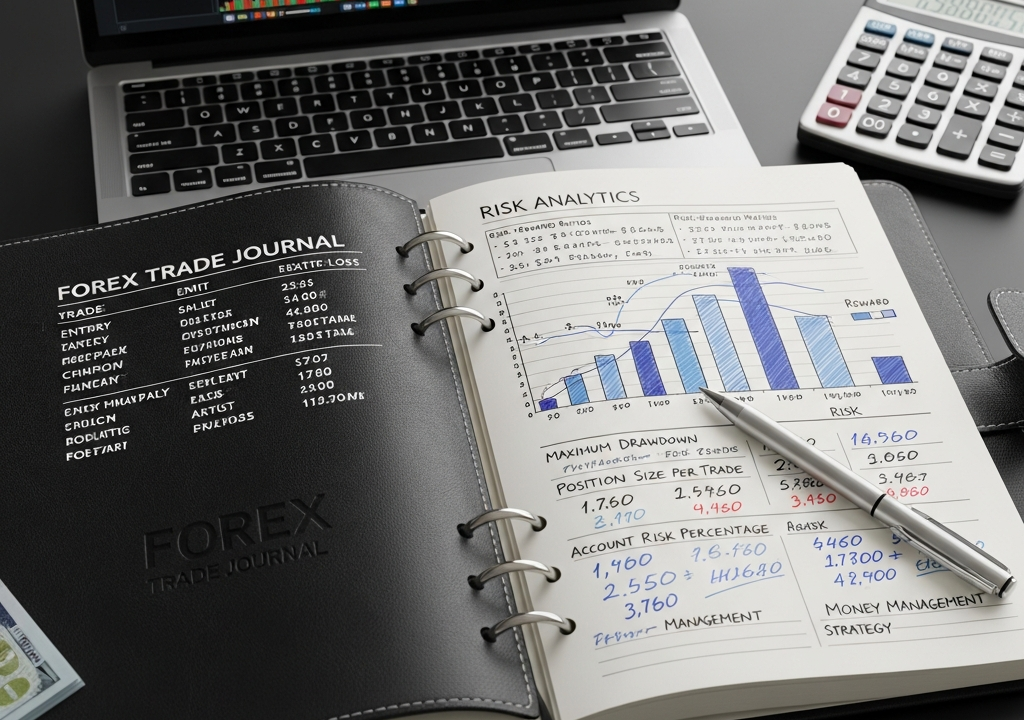
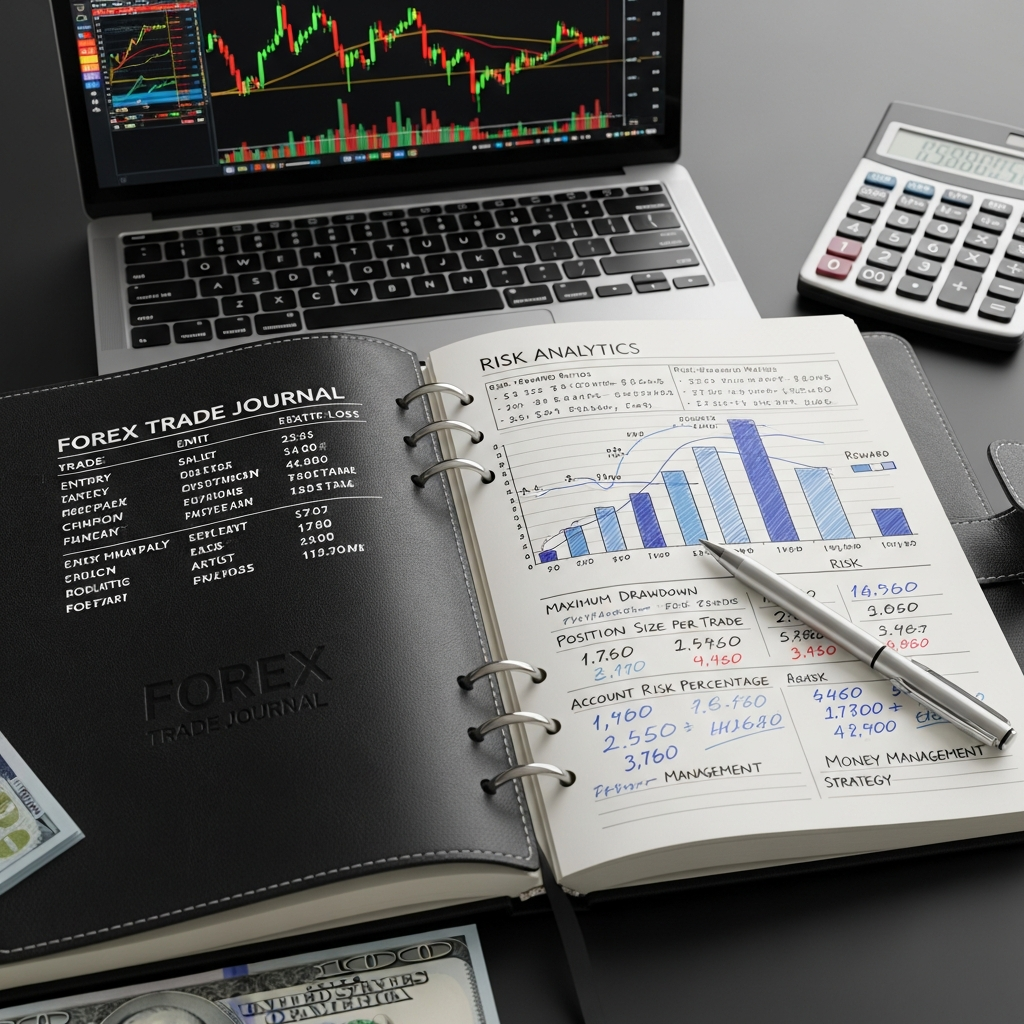
By the time 2026 rolled around, the sheer volume of data available to retail traders skyrocketed. If you aren’t using a forex trade journal with risk analytics, you’re basically flying a jet with a paper map. You need to see the turbulence before it hits your account balance. This isn’t just about record-keeping anymore; it’s about forensic analysis of your own behavior and the mathematical edge of your strategy.
The Hidden Power of a Forex Trade Journal With Risk Analytics
When people hear “risk analytics,” they often think of complex calculus that requires a math degree to understand. In reality, it’s about making the invisible visible. Think about your last ten trades. Do you know your Profit Factor? Do you know if you perform better on Tuesdays than on Fridays? Do you know if your average win-to-loss ratio is actually sustainable when you account for slippage and commissions?
A sophisticated forex trade journal with risk analytics does the heavy lifting for you. Instead of just seeing a red or green number, you get a breakdown of your ‘Expectancy.’ Expectancy tells you exactly how much money you can expect to make for every dollar you risk over the long term. If your expectancy is negative, it doesn’t matter how many trades you win; you’re mathematically guaranteed to go broke eventually. Seeing this number in real-time is the wake-up call most traders need to stop gambling and start treating this like a business.
Breaking Down the Core Metrics
What should you actually be looking for in a modern journal? It’s more than just a list of trades. You need metrics that challenge your assumptions. Here are the ones that actually move the needle:
- Max Drawdown (Relative vs. Absolute): This tells you the maximum pain your account has suffered. Understanding your drawdown helps you set realistic expectations for the future so you don’t panic when things get messy.
- Sharpe and Sortino Ratios: These measure your risk-adjusted return. Are you making 20% by taking massive, unnecessary risks, or are you doing it through disciplined, calculated moves?
- Risk of Ruin: This is perhaps the most terrifying—and useful—stat. It calculates the probability that your current strategy will lead to an account blow-out based on your historical volatility and win rate.
- MFE and MAE (Maximum Favorable/Adverse Excursion): This tracks how much profit you left on the table or how much heat you took before the trade turned in your favor. It’s the ultimate tool for refining your stop losses and take profits.
Stop Guessing and Start Measuring: A Real-World Story
I remember a trader friend of mine, let’s call him Marcus. Marcus was a decent trader. He had a 60% win rate on the EUR/USD, and for months, he was hovering around break-even. He couldn’t figure out why he wasn’t growing. He felt like he was doing everything right. He finally started using a forex trade journal with risk analytics and discovered something fascinating.
His analytics showed that while his win rate was high, his “Time in Trade” for losers was nearly double that of his winners. He was “hope-holding” his losing trades, praying they would turn around, while cutting his winners short the moment he saw a little bit of green. The data showed that if he simply held his winners for 20% longer and cut his losers 10% sooner, his account would have grown by 15% that month alone. He didn’t need a new strategy; he needed to fix his execution based on hard data. That’s the difference between guessing and knowing.

The Psychology Behind the Data
Trading is 10% strategy and 90% psychological warfare against yourself. When you don’t have a forex trade journal with risk analytics, your brain fills the gaps with narratives. “I’m just unlucky today,” or “The market is manipulated.” These narratives are toxic because they remove your personal responsibility. You can’t fix “bad luck,” but you can fix a high correlation risk.
Data acts as an emotional anchor. When you have a bad day—and in 2026, with the high-frequency algorithms and instant news cycles, you will have bad days—you can look at your long-term analytics. Seeing that your strategy has a 65% success rate over the last 500 trades makes that single loss feel insignificant. It prevents the “revenge trading” spiral that destroys so many careers. The analytics prove that you are a profitable trader who just had a bad afternoon, rather than a failure who needs to double his lot size to “get it back.”
Correlation Risk: The Silent Account Killer
One of the biggest benefits of modern risk analytics is identifying correlation. Imagine you’re long on EUR/USD, long on GBP/USD, and short on USD/CHF. You might think you have three diversified trades. However, a deep-dive journal will show you that you actually have one massive bet on Dollar weakness. If the USD suddenly spikes on a surprise Fed comment, you lose on all three positions simultaneously.
A forex trade journal with risk analytics flags these correlations before you pull the trigger. It helps you understand your “Total Account Heat.” If your total exposure to a single currency exceeds your risk tolerance, the software warns you. In the volatile markets of 2026, this kind of insight is the difference between a minor setback and a catastrophic loss.
How to Integrate Journaling into Your Daily Routine
The biggest hurdle to journaling is that it feels like homework. No one wants to spend an hour after a long trading session typing in numbers. The good news is that tech has caught up. Modern journals sync directly via API to your MT4, MT5, or cTrader accounts. The data is pulled automatically, meaning the “risk analytics” part happens in the background while you focus on the charts.
However, automation isn’t an excuse to be lazy. You should still manually enter the “soft data”—your mood, your conviction level, and why you took the trade. Did you take it because the setup was perfect, or because you were bored and felt like you *had* to be in the market? When you combine these qualitative notes with the quantitative forex trade journal with risk analytics, you get a 360-degree view of your trading personality. You’ll start to notice patterns, like how your risk management goes out the window after you’ve had a fight with your spouse or when you haven’t slept enough.
The Sunday Review: Your Most Important Hour
Instead of watching Netflix on Sunday night, spend one hour with your journal. Look at your equity curve. Look at your “Optimal f”—the percentage of your account you should be risking to maximize growth without hitting a point of diminishing returns. Review your mistakes. Not just the ones that lost money, but the ones where you broke your rules and got lucky. In the long run, winning on a bad trade is more dangerous than losing on a good one because it reinforces bad habits.
Building a Sustainable Edge
In the world of professional trading, the edge isn’t found in a magic indicator or a secret “guru” strategy. The edge is found in the refinement of your own process. A forex trade journal with risk analytics is essentially a mirror. It shows you exactly who you are as a trader—the good, the bad, and the ugly.
Traders who survive long-term are the ones who treat their capital with extreme respect. They know their numbers inside and out. They know their maximum drawdown. They know their average win time. They know their losing streaks are statistically normal. This level of certainty doesn’t come from intuition; it comes from a database of your own history.
Choosing the Right Tools for the Job
When looking for a platform in 2026, don’t just settle for a pretty dashboard. Look for deep-tier analytics. You want a tool that offers:
- Automated Import: Zero friction between trading and logging.
- Tagging Systems: Tag trades by “Setup Type” (e.g., Breakout, Mean Reversion) to see which strategies actually work for you.
- Interactive Charts: Visual representations of your entry and exit points on the actual price chart.
- Community Benchmarking: See how your risk metrics compare to other traders in the same asset class.
Final Thoughts for the Modern Trader
The journey from a struggling retail trader to a consistent professional is paved with data. You can’t optimize what you don’t measure. If you’re serious about your growth, it’s time to move past the simple spreadsheets and embrace a forex trade journal with risk analytics. It might be uncomfortable at first to see your flaws laid bare in cold, hard numbers, but that discomfort is the catalyst for growth.
Every professional athlete reviews their game film. Every CEO reviews their quarterly financials. Why should a trader be any different? Your trades are your business transactions, and your journal is your profit and loss statement. Treat it with the seriousness it deserves, and the market might just start treating you like a professional. Stop hoping for a winning streak and start building a system that guarantees you’re around to see the next big move.