The Brutal Reality of the Perfect Backtest
We have all been there. You spend weeks, maybe months, tweaking a strategy. You finally run the backtest, and the equity curve looks like a smooth mountain climb. The profit factor is high, the drawdown is low, and you start calculating how long it will take to buy that house in the hills. You go live, and within three weeks, your account is down 15%, and your confidence is in the gutter. What happened? Why did the reality look nothing like the history?
The truth is that historical data is just one possible path the market could have taken. Traditional backtesting tells you what happened in the past, but it doesn’t tell you what could have happened if the sequence of trades had been slightly different. This is where a Monte Carlo simulation for forex traders becomes the most powerful weapon in your arsenal. It’s the difference between guessing your risk and knowing exactly how much heat your account can handle before it melts down.
In 2026, the markets haven’t become any simpler. With high-frequency AI algorithms and instant global sentiment shifts, the randomness of price action is more apparent than ever. If you are still relying on a simple MT4 or MT5 backtest report, you are essentially flying a plane with half the instruments broken. Let’s dive into how you can use this statistical powerhouse to actually survive the long game.
What Exactly is a Monte Carlo Simulation for Forex Traders?
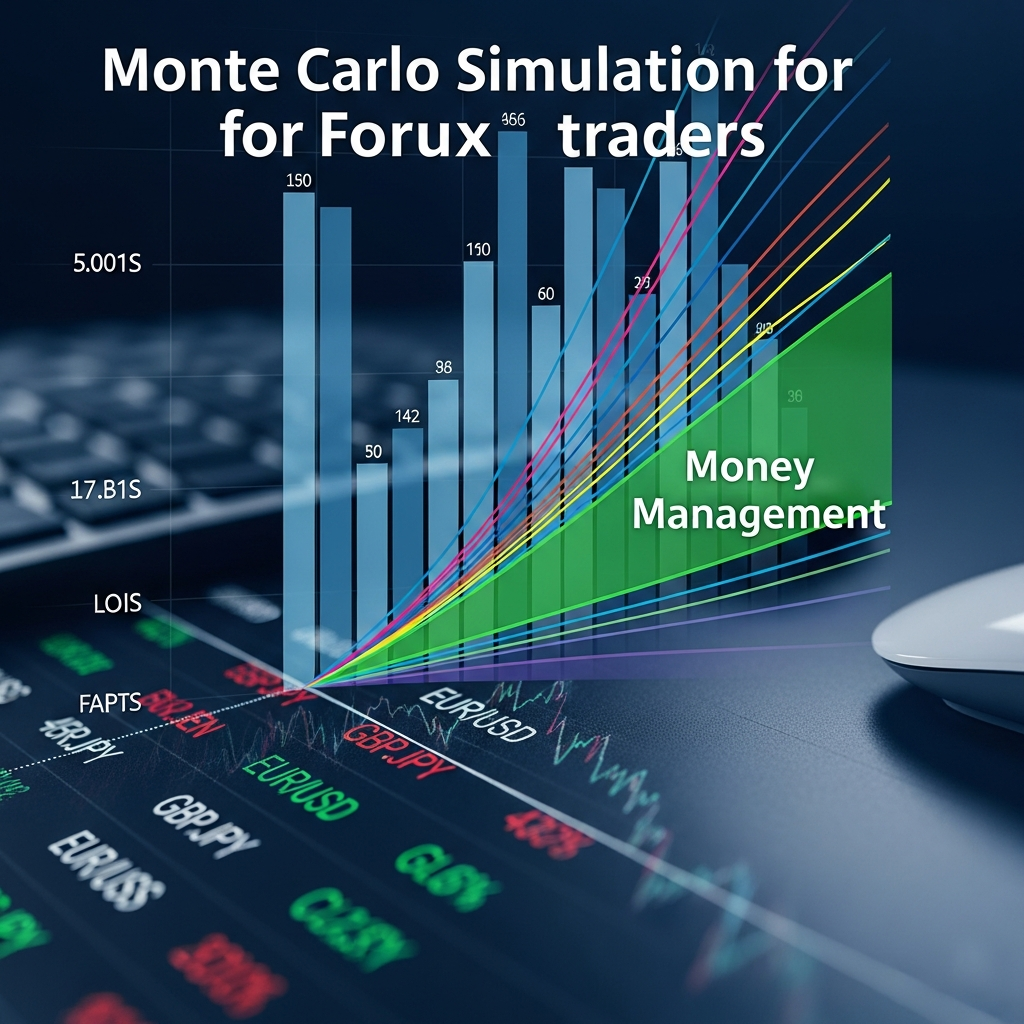
At its core, a Monte Carlo simulation for forex traders is a mathematical technique used to understand the impact of risk and uncertainty in financial models. Instead of looking at your trade history as a fixed sequence, it takes your historical trade data—wins and losses—and shuffles them thousands of times to create thousands of different “alternate realities.”
Think of it like a deck of cards. Your strategy has a certain number of winning cards and losing cards. A standard backtest just shows you how the cards were dealt once. A Monte Carlo simulation reshuffles that deck 10,000 times and deals them out in every possible order. Why does this matter? Because in the real world, you might hit a streak of five losses right at the start of your journey. If your backtest showed those losses spread out over a year, you might not be psychologically or financially prepared for them to happen all at once.
The Power of Randomness
Most traders fail because they don’t understand the “clustering” of losses. Even a strategy with a 60% win rate can statistically have a losing streak of 10 or 12 trades in a row. When you run a Monte Carlo simulation for forex traders, you aren’t looking for the best-case scenario. You are looking for the “Risk of Ruin”—the mathematical probability that your account will hit zero before it hits its profit target. By simulating these thousands of variations, you get a clear percentage of how likely you are to blow up based on your current risk per trade.
Setting Up the Simulation in 2026
Years ago, you needed a degree in statistics or expensive custom software to run these simulations. In 2026, the tools have become much more accessible, yet the logic remains the same. To get started, you need a sample size of at least 30 to 50 trades from your current strategy. More is always better, but 50 gives the simulation enough “DNA” to work with.
- Step 1: Export your data. Pull your trade list into a CSV format. You need the profit/loss amount for each trade, either in pips or currency.
- Step 2: Define your parameters. How many simulations do you want to run? Usually, 5,000 to 10,000 is the sweet spot. What is your starting balance? What is your maximum tolerable drawdown?
- Step 3: Run the shuffle. The software will take your trades and reorder them randomly. It might even use “replacement” logic, where it can pick the same trade multiple times, simulating a world where your worst loss happens three times in a row.
- Step 4: Analyze the distribution. You will get a bell curve or a series of equity lines. The outliers are what you care about.
Interpreting the Data Without a Ph.D.
When you look at your results, don’t get distracted by the average return. Look at the “Confidence Intervals.” If the simulation says there is a 95% confidence level that your drawdown will stay under 20%, that’s a great sign. However, if there is even a 1% chance of 100% drawdown (total wipeout), your position sizing is too aggressive. A 1% chance of ruin might sound small, but in the world of probability, if you play long enough, that 1% will eventually find you.
The Psychological Edge: Trading with a Safety Net
One of the biggest pain points for forex traders is the “What if?” factor. When you’re in the middle of a four-trade losing streak, you start questioning everything. Is the strategy broken? Is the market changing? Am I just bad at this? Use of the Monte Carlo simulation for forex traders provides the psychological anchor you need during these dark times.
If you have run the numbers and you know that a 15-trade losing streak is a 2% mathematical possibility, then when you hit your 5th loss, you don’t panic. You realize you are just experiencing a normal statistical variation. You stay disciplined because you have already “seen” this scenario in your simulations. It turns fear into data, and in the forex market, data is the only thing that keeps you rational when everyone else is reacting emotionally.
Going Beyond the Basics: Advanced Simulation Techniques
As we move deeper into 2026, many professional retail traders are moving beyond simple reshuffling. They are using “parameter permutation.” This involves not just shuffling the order of trades, but slightly altering the values of the trades themselves. What if your average win was 10% smaller? What if your average loss was 5% larger due to slippage during high-volatility events like central bank announcements?
This “stress testing” is vital. The forex market is notoriously thin during certain sessions, and spreads can blow out. By simulating a slightly worse version of your strategy, you build a margin of safety. If your strategy still survives a Monte Carlo simulation for forex traders even after you’ve artificially worsened the data by 10%, you have found a robust system that can likely withstand the chaos of live trading.
Avoiding the Over-Optimization Trap
There is a danger here, though. Some traders use these simulations to “force” a strategy to look good. They filter out the outliers or only simulate their best months. This is a recipe for disaster. The whole point of the Monte Carlo simulation for forex traders is to find the cracks in your armor before the market finds them for you. If you lie to the simulation, the market will eventually tell you the truth—and it will be expensive.
Common Mistakes to Watch Out For
While this tool is incredibly powerful, it isn’t magic. There are a few ways traders often trip themselves up when first starting out with these simulations.
- Small Sample Sizes: Trying to run a simulation on 10 trades is useless. It’s like trying to predict the weather for the next year based on what happened this morning. You need enough data to capture the variance of your strategy.
- Ignoring Market Regime Changes: A simulation based on a trending market might look amazing, but it won’t warn you about what happens when the market goes into a tight range. It’s often best to run separate simulations for different market conditions.
- Underestimating Slippage: Many backtests assume perfect execution. In reality, you will have pips stolen by the spread and execution delays. Always add a “fudge factor” to your losses in the simulation to account for the cost of doing business.
Practical Application: Adjusting Your Risk per Trade
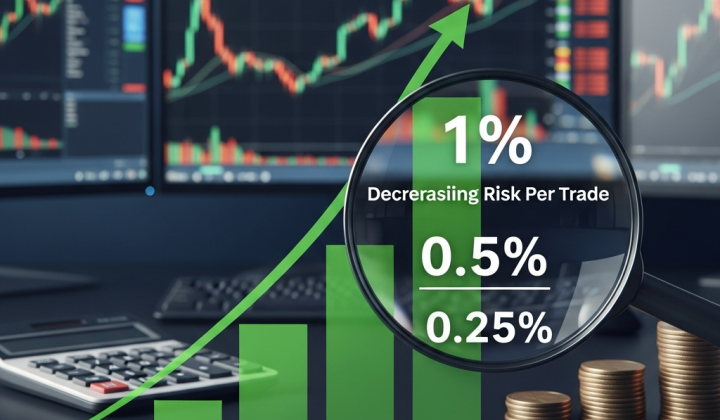
Let’s say you currently risk 2% per trade. You run a Monte Carlo simulation for forex traders and find that you have a 15% chance of hitting a 50% drawdown within 500 trades. For most people, that’s too much risk. By simply lowering your risk to 1% per trade and rerunning the simulation, you might find that your chance of that 50% drawdown drops to 0.5%.
This is the “aha!” moment for many. You realize that you don’t need a better strategy; you just need better math. You can achieve almost the same long-term growth with drastically less risk of blowing up, simply by finding that statistical sweet spot. This allows you to trade with “conviction,” which is a rare commodity in the forex world.
Integrating Simulation into Your Routine
You shouldn’t just run this once and forget it. As you take new trades every week, your “DNA”—your actual trading performance—is changing. Maybe your win rate is dipping, or your reward-to-risk ratio is improving. Once a month, update your trade list and rerun the Monte Carlo simulation for forex traders. This acts as a pulse check on your performance.
If the simulation starts showing a higher risk of ruin than it did last month, it’s a leading indicator that something is wrong. Maybe you’re losing your edge, or maybe you’re letting your losses run too long. It gives you a way to catch mistakes before they become catastrophic. It’s like having a co-pilot who is constantly recalculating your fuel levels based on the current wind speeds.
Final Thoughts on Mastering the Odds
Success in forex isn’t about being right about the direction of EUR/USD or GBP/JPY. It’s about being the house, not the gambler. The house wins because it understands the math of the game and has the bankroll to survive the variance. By using a Monte Carlo simulation for forex traders, you effectively turn your trading into a business where you are the actuary, not just the guy clicking ‘buy’ or ‘sell.’
The road to consistent profitability is paved with boring statistics. It’s not as exciting as chasing a 100-pip move during NFP, but it is what keeps you in the game for the long haul. Take your historical data, embrace the randomness, and stop guessing about your risk. Once you see the thousands of ways your trading career could play out, you’ll find a level of peace and discipline that no chart pattern could ever give you. The market is a chaotic place, but your risk management doesn’t have to be.