
The Day I Stopped Guessing the Market
I still remember the first time I stared at a Volatility 75 (V75) chart back in the day. It felt like trying to tame a wild animal. The price moves were lightning-fast, and unlike the regular Forex markets I was used to, there were no central bank speeches or NFP reports to guide me. Synthetic indices are purely mathematical, driven by algorithms that simulate real-world market volatility 24/7. It took me a long time, and a few blown accounts, to realize that you can’t trade these indices based on ‘gut feeling’.
Everything changed when I went back to the basics and started experimenting with a moving average crossover for synthetic indices. It sounds simple—maybe even too simple for some—but in a market that doesn’t care about the Federal Reserve or global politics, price action and trend-following indicators are your only real allies. If you’ve been struggling to catch those massive swings on V100 or getting caught in the spikes of Boom 1000, you are in the right place. Let’s break down why this strategy is a game-changer in 2026.
Why Synthetic Indices Play by Different Rules
Before we dive into the moving average crossover for synthetic indices, we need to talk about what makes these markets unique. Synthetic indices, primarily offered by Deriv, aren’t affected by global news. If there is a war or a massive economic shift, the V75 or the Jump 10 indices won’t even flinch. They follow a cryptographically secure random number generator.
Because these markets are purely algorithmic, they tend to respect technical levels and mathematical averages far more consistently than traditional currencies. They don’t have ‘noise’ from news spikes that hunt your stop loss. This makes indicators like moving averages incredibly potent because they act as a direct mirror to the underlying algorithm’s momentum.
The Core Logic of the Crossover
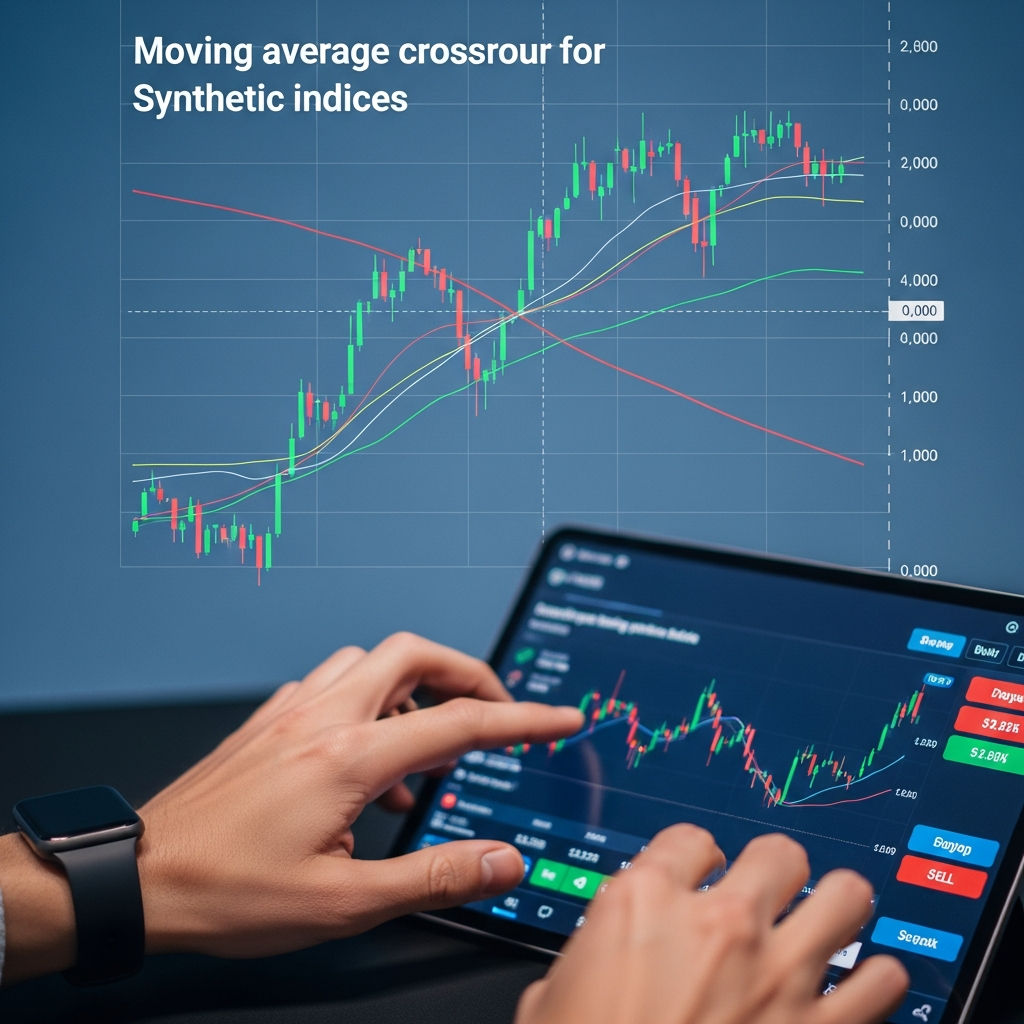
A moving average crossover for synthetic indices works on a basic principle: when a fast-moving average crosses over a slow-moving average, it signals a change in momentum. In the world of synthetics, momentum is king. Since there are no fundamental ‘value’ drivers, a trend is simply the algorithm’s current path. If you can catch that path early, you’re golden.
Setting Up Your Chart for Success
Most traders fail because they use the wrong periods. If you use a 200-period moving average on a 1-minute chart for V75, you’re going to get signals that are so lagged they are essentially useless. In 2026, the market speed has increased slightly, and we need to be more surgical.
The “Golden Combo” for V75 and V100
For high-volatility indices, I’ve found that the 10-period Exponential Moving Average (EMA) and the 21-period EMA are the sweet spot. Why the EMA? Because it weighs recent price data more heavily than the SMA (Simple Moving Average). In a market that moves as fast as synthetic indices, you need that responsiveness.
- Fast EMA: 10 (Red)
- Slow EMA: 21 (Blue)
- Timeframe: 15-Minute (M15) or 1-Hour (H1)
When the 10 EMA crosses above the 21 EMA, it’s a buy signal. When it crosses below, it’s a sell. But hold on—don’t just click ‘buy’ every time they touch. We need a filter.
The Hidden Trap: The Whipsaw
The biggest enemy of the moving average crossover for synthetic indices is the sideways market. You’ve seen it: the lines intertwine like a pair of spaghetti noodles, and your account balance slowly bleeds out from small losses. To avoid this, I always look for “separation.”
Don’t enter the trade the second the lines touch. Wait for the candle to close and see if the moving averages are actually fanning out. If they are opening up like a pair of scissors, that’s a high-probability trade. If they are hugging each other, stay away. Your patience is your biggest edge here.

Strategy 1: The Scalper’s Delight (M5/M15)
If you love the thrill of quick trades, the moving average crossover for synthetic indices on lower timeframes is where the action is. This is particularly effective for indices like Volatility 10 (1s) or Volatility 25.
Here, I use a 9-period EMA and a 50-period EMA. The 50 EMA acts as the ‘boss.’ If price is above the 50 EMA, I only look for bullish crossovers of the 9 EMA. This simple rule—trading in the direction of the higher-order trend—will save you more money than any fancy bot ever could.
Strategy 2: The Trend Rider (H4/Daily)
For those who have a day job or just want a more relaxed approach, the H4 timeframe is a goldmine. Synthetic indices can trend for weeks. Think about it: because there’s no news to reverse a trend, once a V75 trend starts, it can go on an absolute tear.
A moving average crossover for synthetic indices using the 50 SMA and the 200 SMA is the classic “Golden Cross.” When this happens on an H4 chart of Volatility 100, you aren’t looking for 50 pips. You are looking for a move that could last three days. I’ve seen traders turn small accounts into substantial ones just by catching one or two of these massive moves per month.
The Special Case: Boom and Crash Indices
Trading a moving average crossover for synthetic indices on Boom and Crash is a bit different. You have to remember that Boom indices spike UP and Crash indices spike DOWN.
If you are trying to catch the spikes, look for the crossover on the M1 chart. However, I prefer trading the “tick” (the small candles against the spikes). If you use a 50 and 100 EMA crossover on a Crash 1000 M15 chart, you can safely ride the downward trend until the EMA signals a reversal. Just make sure your stop loss is wide enough to survive a single spike, or better yet, use small lot sizes.
Psychology and Risk in 2026
Let’s get real for a second. The strategy isn’t the hard part. The hard part is not closing your trade too early when you see a tiny bit of red. Or worse, not closing it when the moving average crossover for synthetic indices actually tells you to exit because you’re “hoping” it will turn around.
Synthetic indices are open on Saturdays. They are open on Christmas. They are open while you sleep. The market doesn’t get tired, but you do. My rule is simple: if the EMA cross happens while I’m exhausted or emotional, I don’t take it. The market will be there tomorrow. The algorithm doesn’t sleep, and it doesn’t have a bias—neither should you.
Refining Your Entry with Price Action
To really master the moving average crossover for synthetic indices, you should combine it with basic market structure. If you see a crossover happening right at a previous support-turned-resistance level, that’s a “confluence” trade. These are the setups where I personally feel comfortable increasing my position size.
Imagine V75 has been hitting a ceiling at a certain price level. Suddenly, the price breaks through, and at the same time, your 10 EMA crosses above the 21 EMA. That’s the market telling you in two different languages that it wants to go higher. That is where the magic happens.
Common Mistakes to Avoid
I’ve seen thousands of traders try to use a moving average crossover for synthetic indices, and most of them make the same three mistakes:
- Over-leveraging: Because synthetics offer high leverage, people trade too big. A crossover isn’t a 100% guarantee; it’s a probability. Respect the math.
- Ignoring the Trend: Taking a buy crossover when the overall daily trend is bearish. Always check the higher timeframe first.
- Chasing the Move: If the crossover happened 10 candles ago and the price is already far away from the EMA lines, you missed it. Wait for a pullback or the next cross.
Why This Strategy Still Rules in 2026
We are seeing more AI-driven tools in the trading world than ever before. But these tools are often over-engineered. The moving average crossover for synthetic indices remains effective because it is a visual representation of average price behavior. It cuts through the complexity. Whether you are using a phone or a high-end multi-monitor setup, these lines provide a clear yes/no answer to the most important question in trading: Which way is the money moving?
The beauty of synthetic indices is their consistency. They don’t have “Black Swan” events caused by a politician’s tweet. They only have supply, demand, and the underlying mathematical rhythm. By using moving averages, you are essentially syncing your trading with that rhythm.
A Final Piece of Advice
If you are new to this, start on a demo account. Spend a week just watching how the 10 and 21 EMAs interact on Volatility 75. Don’t even place a trade. Just watch. Notice how the price pulls back to the EMA lines before continuing the trend. Notice how the crossover often happens just before a major breakout. Once you see the pattern, you can’t unsee it.
Trading the moving average crossover for synthetic indices isn’t about being the smartest person in the room. It’s about being the most disciplined. Stick to your parameters, manage your risk like your life depends on it (because your account does), and let the math do the heavy lifting for you. See you on the charts.